Home » 2021
Yearly Archives: 2021
Dataset of Visualization of Dynamic Graphs
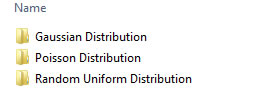
We provided three distribution functions (e.g., Gaussian distribution, Poisson distribution and random distribution) to simulate the time intervals for updating (insertion of new nodes and edges) the graphs.
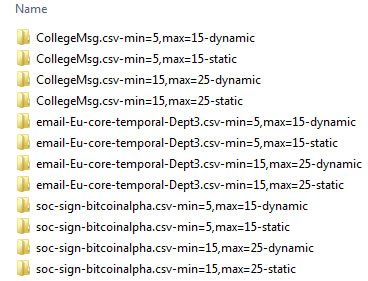
Moreover, we selected three datasets with varying size, temporal edges and duration of time interval in the dataset.
- Dataset email-Eu-core-temporalDept3 (*) is an incoming and outgoing traffic for E-Mail graph. A separate edge is created for each recipient of the e-mail.
- Dataset CollegeMsg (**) is a temporal graph comprised of private messages sent on an online social network at the University of California.
- Dataset soc-sign-bitcoinalpha (***) is a transaction graph in BitCoin Alpha.
- (*) Paranjape, Ashwin, Austin R. Benson, and Jure Leskovec. “Motifs in temporal networks.” Proceedings of the Tenth ACM International Conference on Web Search and Data Mining. 2017.
- (**) Panzarasa, Pietro, Tore Opsahl, and Kathleen M. Carley. “Patterns and dynamics of users’ behavior and interaction: Network analysis of an online community.” Journal of the American Society for Information Science and Technology 60.5 (2009): 911-932.
- (***) Kumar, Srijan, et al. “Edge weight prediction in weighted signed networks.” 2016 IEEE 16th International Conference on Data Mining (ICDM). IEEE, 2016.
Each distribution contains static (the name of folder ends with static) and dynamic datasets (the name of folder ends with dynamic):
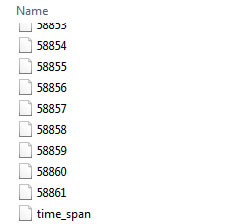
Each dataset contains a time_span file (the time intervals for updating the graphs) and graph files. The data structure of graph file is the same as the Dataset of CNCAH Network.
Download:
- Gaussian Distribution (22.17 GB after extraction, 554,288 files)
- Poisson Distribution (11.08 GB after extraction, 277,144 files)
- Random Uniform Distribution (11.00 GB after extraction, 277,144 files)
If you use the dataset for your research/development, please cite the following paper:
Cheong, Se-Hang, Yain-Whar Si, and Raymond K. Wong. "Online force-directed algorithms for visualization of dynamic graphs." Information Sciences 556 (2021): 223-255.
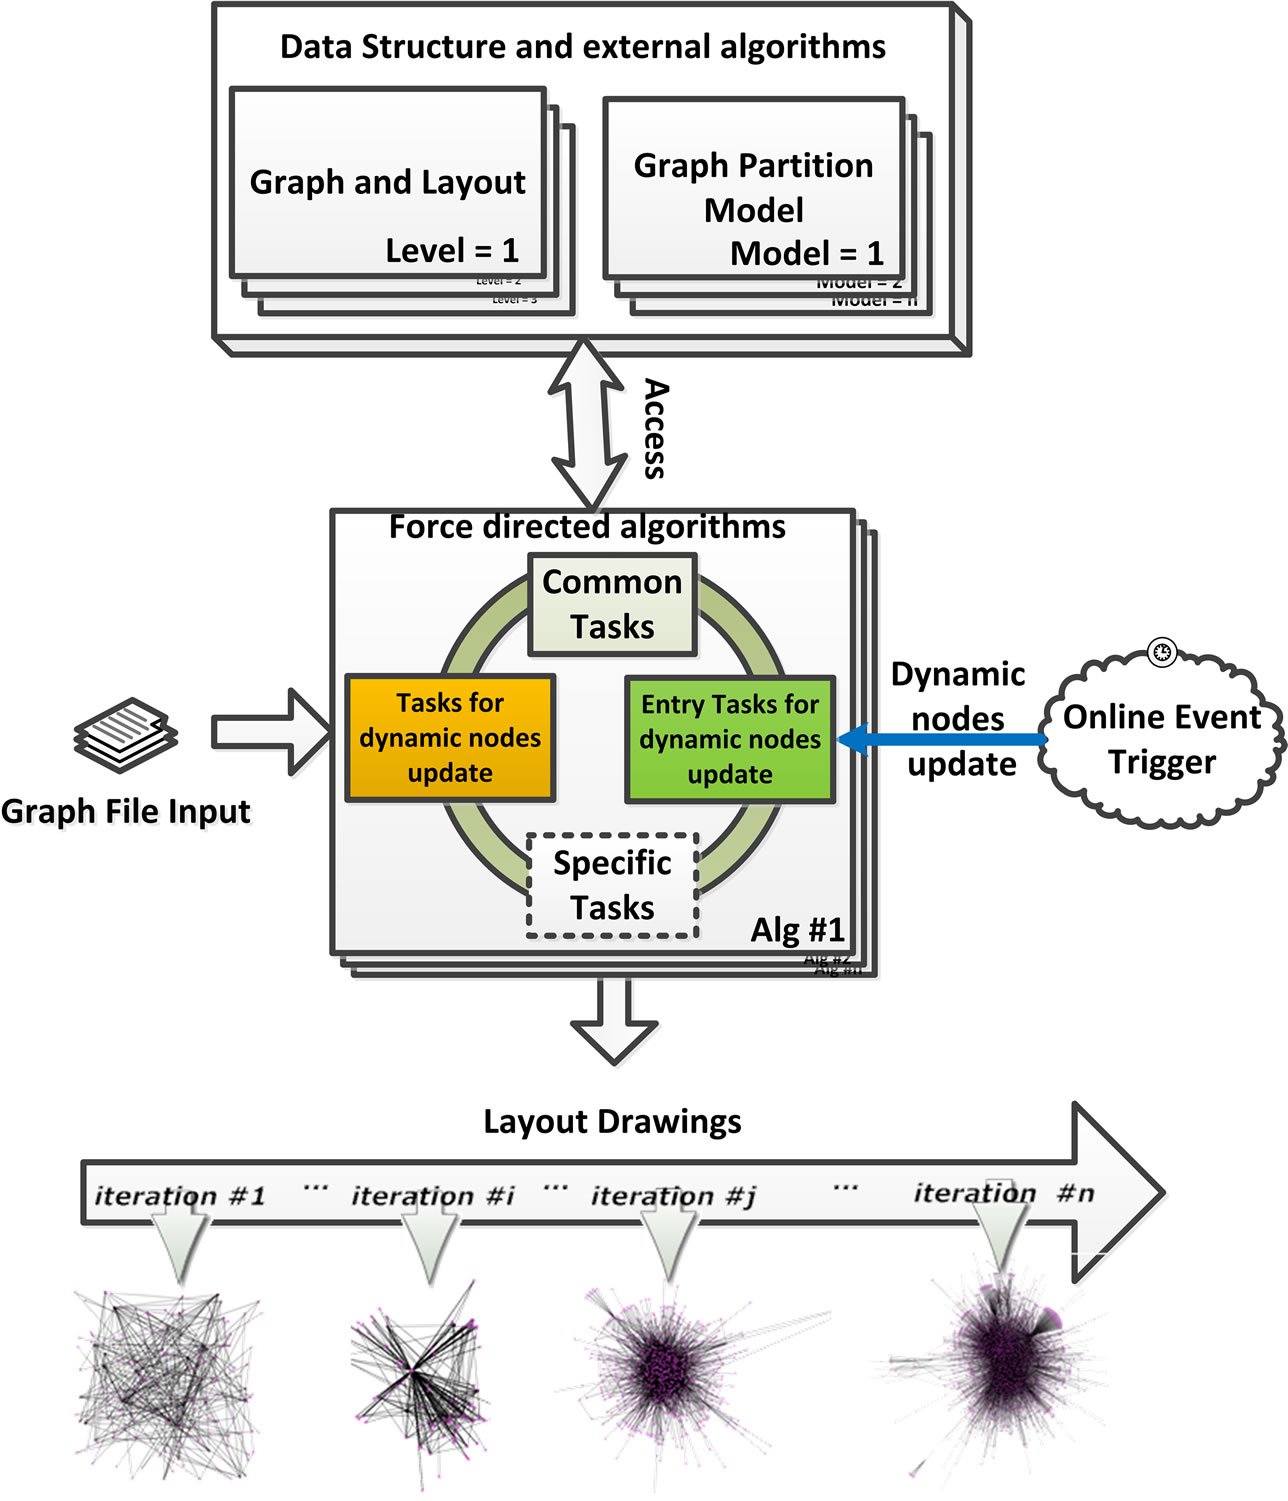
Online Force Directed Algorithms for Visualization of Dynamic Graphs
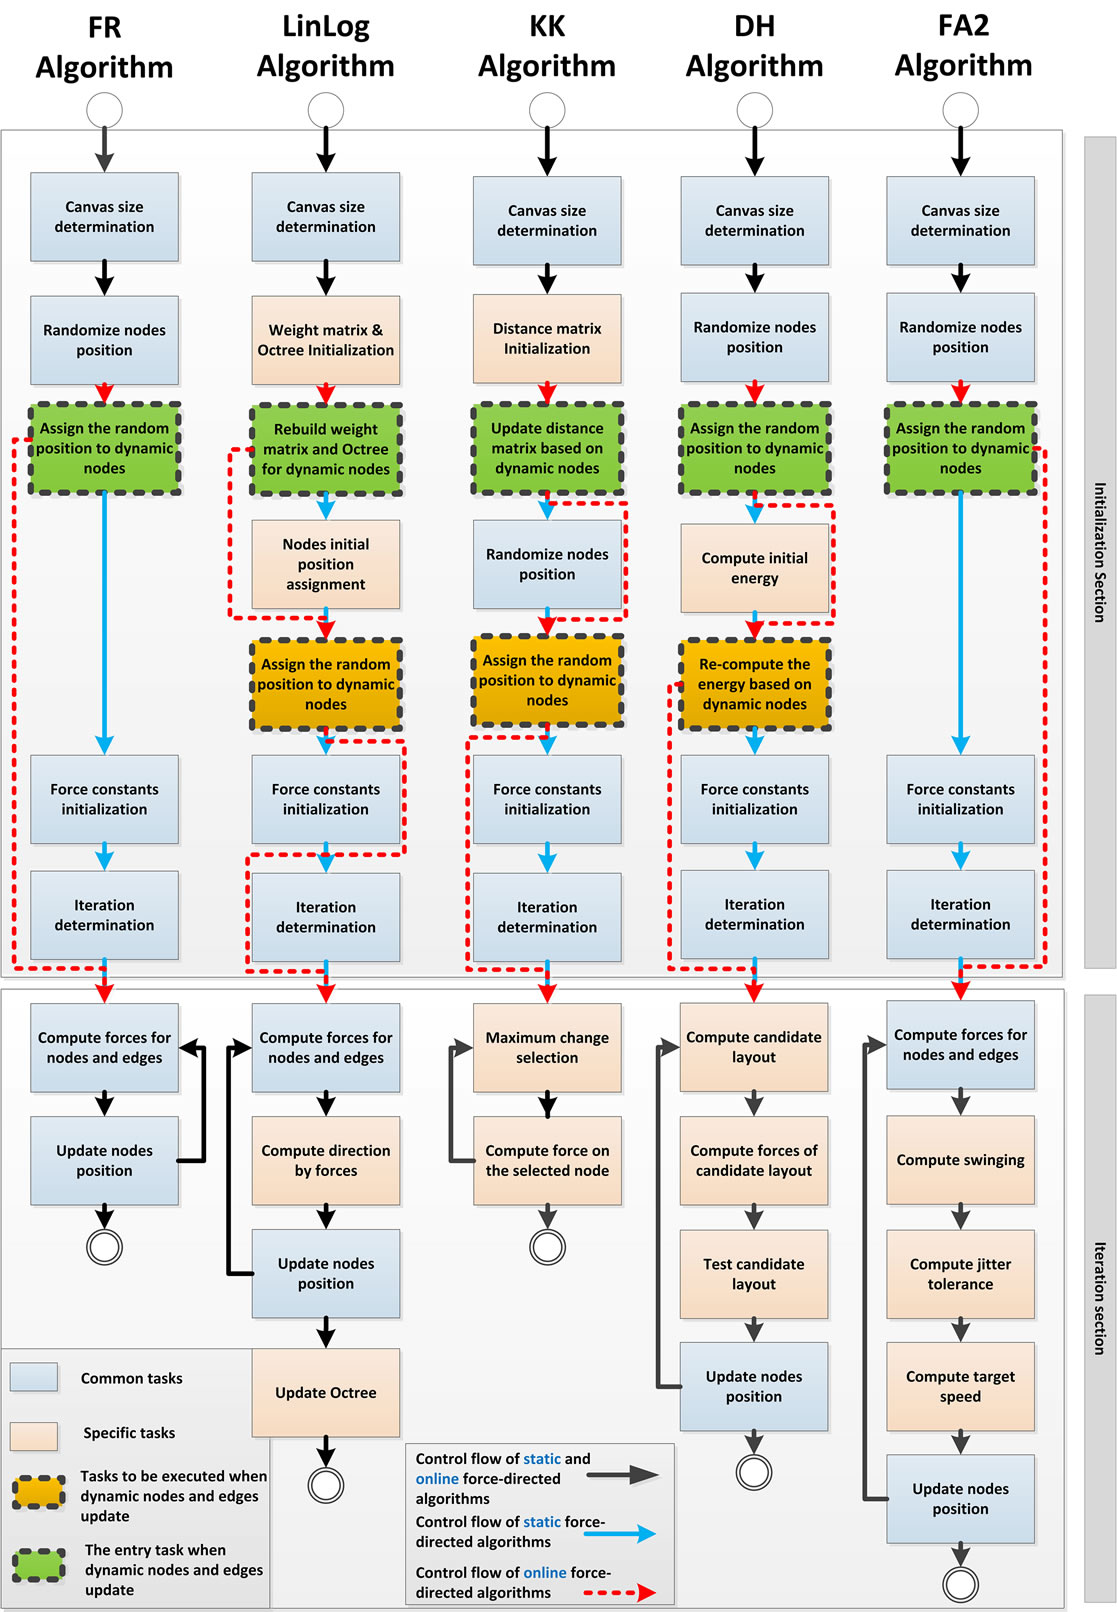
Visualization of dynamic graphs allows analysts to observe any changes in the graphs over time to find hidden relationships and patterns. Force-directed (FD) algorithms were considered as one of the main techniques for visualization of static graphs. In this paper, we propose a novel approach for the design and implementation of five online force-directed (OFD) algorithms for visualization of dynamic graphs using Node-and-Link layouts. The proposed OFD algorithms are designed to achieve properties such as re-usability, scalability, and compatibility.
We evaluate the performance between FD and OFD algorithms based on the number of edge crossing, the standard deviation of edge length, variance of edge crossing and execution time with respect to varying numbers of nodes and average degrees in dynamic graphs. We show that the proposed OFD algorithms can significantly lower the computational cost for visualization of large dynamic graphs. To the best of our knowledge, our approach is the first systematic and bottom-up design of OFD algorithms in which existing force models of FD can be reused in OFD algorithms without significant modification.
The author’s version of a work that was accepted for publication can be downloaded from http://eric.lostcity-studio.com/wp-content/uploads/2021/02/OFD-Dynamic.pdf. Se-Hang Cheong, Yain-Whar Si, Raymond K.Wong. “Online Force Directed Algorithms for Visualization of Dynamic Graphs“, Information Sciences, Volume 556, May 2021, Pages 223-255.