Dataset of Visualization of Dynamic Graphs
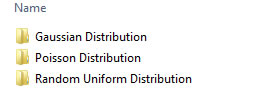
We provided three distribution functions (e.g., Gaussian distribution, Poisson distribution and random distribution) to simulate the time intervals for updating (insertion of new nodes and edges) the graphs.
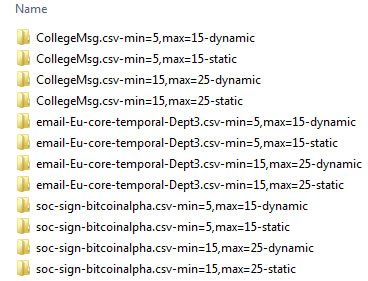
Moreover, we selected three datasets with varying size, temporal edges and duration of time interval in the dataset.
- Dataset email-Eu-core-temporalDept3 (*) is an incoming and outgoing traffic for E-Mail graph. A separate edge is created for each recipient of the e-mail.
- Dataset CollegeMsg (**) is a temporal graph comprised of private messages sent on an online social network at the University of California.
- Dataset soc-sign-bitcoinalpha (***) is a transaction graph in BitCoin Alpha.
- (*) Paranjape, Ashwin, Austin R. Benson, and Jure Leskovec. “Motifs in temporal networks.” Proceedings of the Tenth ACM International Conference on Web Search and Data Mining. 2017.
- (**) Panzarasa, Pietro, Tore Opsahl, and Kathleen M. Carley. “Patterns and dynamics of users’ behavior and interaction: Network analysis of an online community.” Journal of the American Society for Information Science and Technology 60.5 (2009): 911-932.
- (***) Kumar, Srijan, et al. “Edge weight prediction in weighted signed networks.” 2016 IEEE 16th International Conference on Data Mining (ICDM). IEEE, 2016.
Each distribution contains static (the name of folder ends with static) and dynamic datasets (the name of folder ends with dynamic):
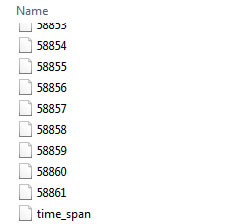
Each dataset contains a time_span file (the time intervals for updating the graphs) and graph files. The data structure of graph file is the same as the Dataset of CNCAH Network.
Download:
- Gaussian Distribution (22.17 GB after extraction, 554,288 files)
- Poisson Distribution (11.08 GB after extraction, 277,144 files)
- Random Uniform Distribution (11.00 GB after extraction, 277,144 files)
If you use the dataset for your research/development, please cite the following paper:
Cheong, Se-Hang, Yain-Whar Si, and Raymond K. Wong. "Online force-directed algorithms for visualization of dynamic graphs." Information Sciences 556 (2021): 223-255.
Online Force Directed Algorithms for Visualization of Dynamic Graphs
Visualization of dynamic graphs allows analysts to observe any changes in the graphs over time to find hidden relationships and patterns. Force-directed (FD) algorithms were considered as one of the main techniques for visualization of static graphs. In this paper, we propose a novel approach for the design and implementation of five online force-directed (OFD) algorithms for visualization of dynamic graphs using Node-and-Link layouts. The proposed OFD algorithms are designed to achieve properties such as re-usability, scalability, and compatibility.
We evaluate the performance between FD and OFD algorithms based on the number of edge crossing, the standard deviation of edge length, variance of edge crossing and execution time with respect to varying numbers of nodes and average degrees in dynamic graphs. We show that the proposed OFD algorithms can significantly lower the computational cost for visualization of large dynamic graphs. To the best of our knowledge, our approach is the first systematic and bottom-up design of OFD algorithms in which existing force models of FD can be reused in OFD algorithms without significant modification.
The author’s version of a work that was accepted for publication can be downloaded from http://eric.lostcity-studio.com/wp-content/uploads/2021/02/OFD-Dynamic.pdf. Se-Hang Cheong, Yain-Whar Si, Raymond K.Wong. “Online Force Directed Algorithms for Visualization of Dynamic Graphs“, Information Sciences, Volume 556, May 2021, Pages 223-255.
Force-directed algorithms for schematic drawings and placement: A survey
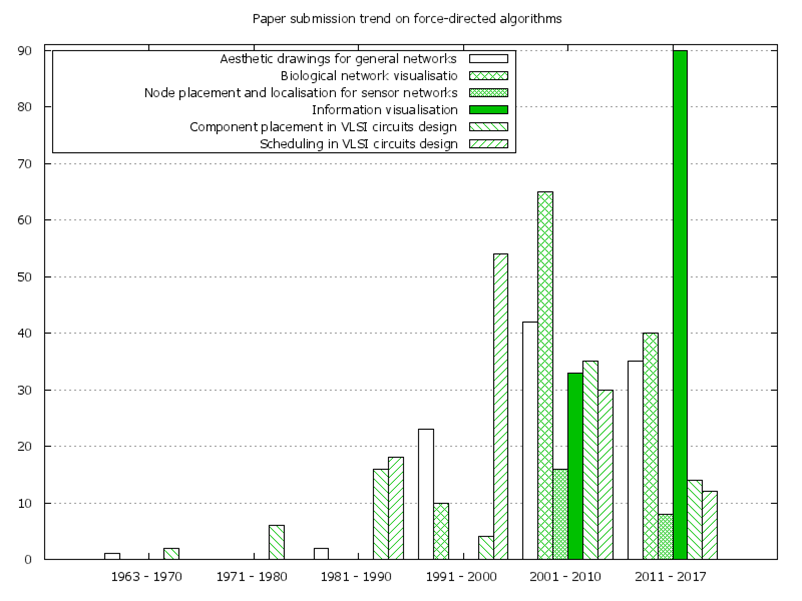
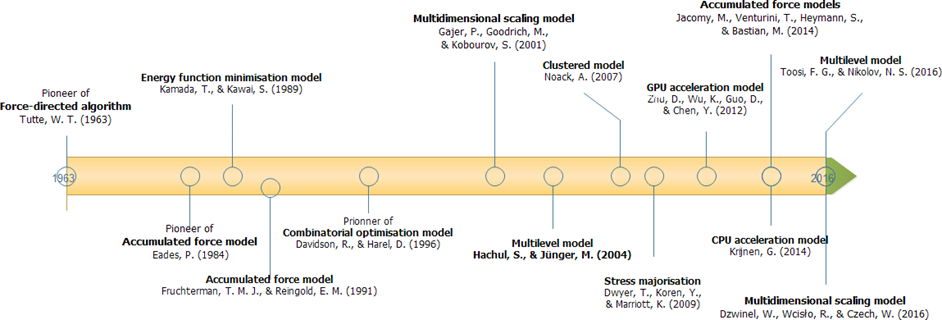
Force-directed algorithms have been developed over the last 50 years and used in many application fields, including information visualisation, biological network visualisation, sensor networks, routing algorithms, scheduling, graph drawing, etc. Our survey provides a comprehensive summary of developments and a full roadmap for state-of-the-art force-directed algorithms in schematic drawings and placement.
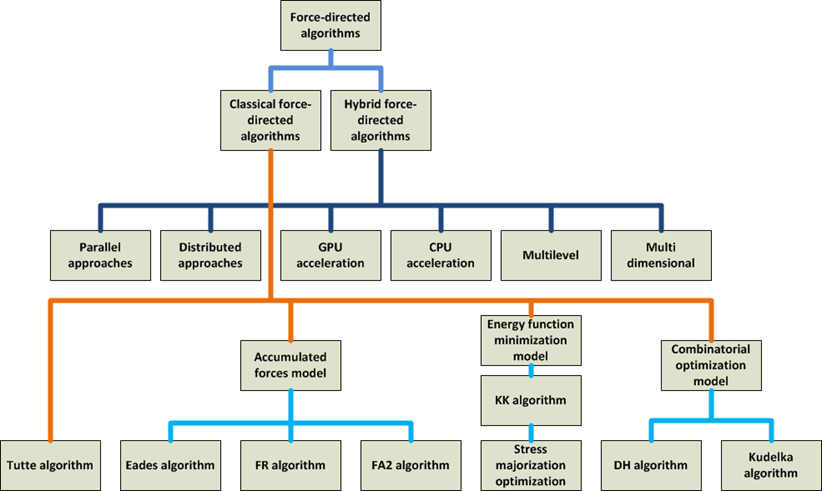
We classified the model of force-directed algorithms into classical and hybrid. The classical force-directed algorithms are further classified as follows: (a) accumulated force models, (b) energy function minimisation models, and (c) combinatorial optimisation models. The hybrid force-directed algorithms are classified as follows: (a) parallel and hardware accelerated models, (b) multilevel force-directed models, and (c) multidimensional scaling force-directed algorithms. Five categories of application domains in which force-directed algorithms have been adopted for schematic drawings and placement are also summarised: (a) aesthetic drawings for general networks, (b) component placement and scheduling in high-level synthesis of very-large scale integration (VLSI) circuits design, (c) information visualisation, (d) biological network visualisation, and (e) node placement and localisation for sensor networks.
The author’s version of a work that was accepted for publication can be downloaded from http://eric.lostcity-studio.com/wp-content/uploads/2019/08/Force-directed-algorithms-for-schematic-drawings-and-placement:a-Survey.pdf.

Se-Hang Cheong, Yain-Whar Si. "Force-directed algorithms for schematic drawings and placement: A survey", Information Visualization, Accepted and to appear, Sage, 2019.
Snapshot Visualization of Complex Graphs with Force-directed Algorithms
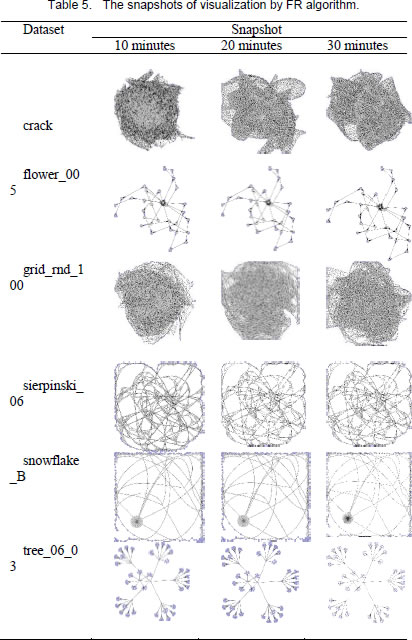
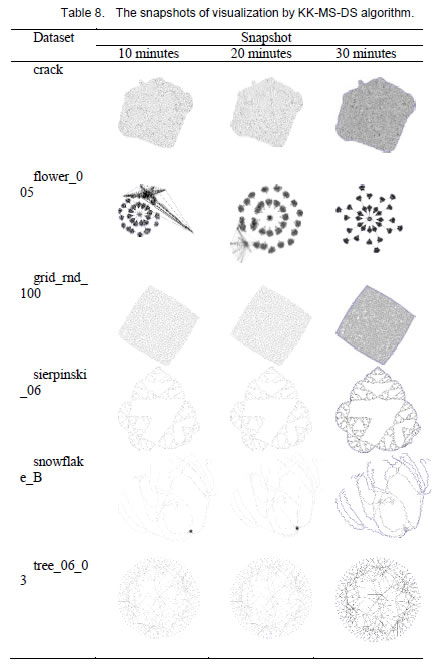
Force-directed algorithms are widely used for visualizing graphs. However, these algorithms are computationally expensive in producing good quality layouts for complex graphs. The layout quality is largely influenced by execution time and methods’ input parameters especially for large complex graphs. The snapshots of visualization generated from these algorithms are useful in presenting the current view or a past state of an information on timeslices. Therefore, researchers often need to make a trade-off between the quality of visualization and the selection of appropriate force-directed algorithms.
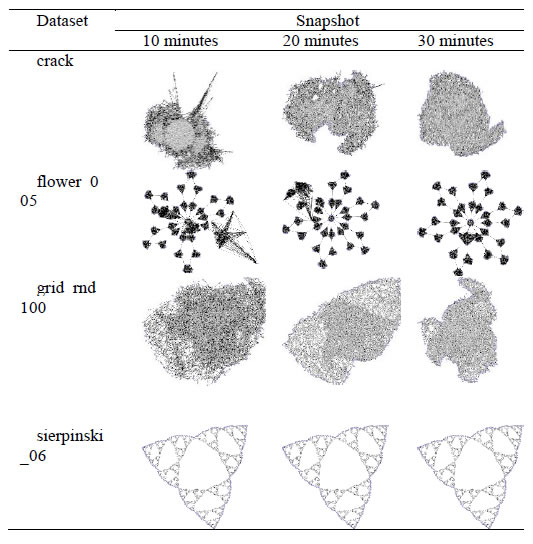
In this paper, we evaluate the quality of snapshots generated from 7 force-directed algorithms in terms of number of edge crossing and the standard deviations of edge length. Our experimental results showed that KK, FA2 and DH algorithms cannot produce satisfactory visualizations for large graphs within the time limit. KK-MS-DS algorithm can process large and planar graphs but it does not perform well for graphs with low average degrees. KK-MS algorithm produces better visualizations for sparse and non-clustered graphs than KK-MS-DS algorithm.
The author’s version of a work that was accepted for publication can be downloaded from http://eric.lostcity-studio.com/wp-content/uploads/2019/08/Snapshot-Visualization-of-Complex-Graphs-with-Force-directed-Algorithms.pdf.
Se-Hang Cheong, Yain-Whar Si. "Snapshot Visualization of Complex Graphs with Force-directed Algorithms", Proceedings of the IEEE International Conference on Big Knowledge (ICBK), pp. 139-145, IEEE Press, 2018.
CWBound: boundary node detection algorithm for complex non-convex mobile ad hoc networks
Efficient message forwarding in mobile ad hoc network in disaster scenarios is challenging because location information on the boundary and interior nodes is often unavailable. Information related to boundary nodes can be used to design efficient routing protocols as well as to prolong the battery power of devices along the boundary of an ad hoc network. In this article, we developed an algorithm, CWBound, which discovers boundary nodes in a complex non-convex mobile ad hoc (CNCAH) networks.
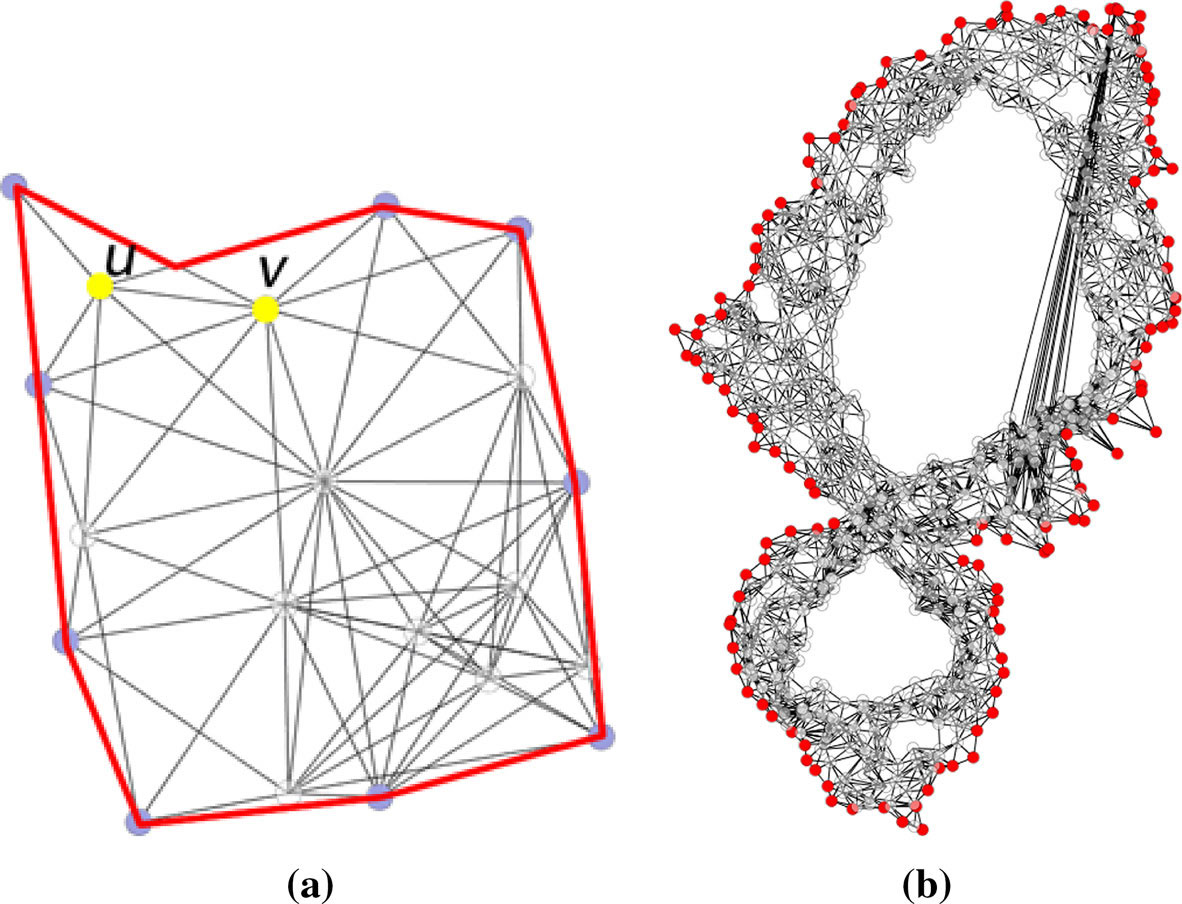
Experiments show that the CWBound algorithm is at least 3 times faster than other state-of-the-art algorithms, and up to 400 times faster than classical force-directed algorithms. The experiments also confirmed that the CWBound algorithm achieved the highest accuracy (above 97% for 3 out of the 4 types of CNCAH networks) and sensitivity (90%) among the algorithms evaluated.
The author’s version of a work that was accepted for publication can be downloaded from http://eric.lostcity-studio.com/wp-content/uploads/2019/08/CWBound.pdf.

Se-Hang, Cheong, and Yain-Whar Si. "CWBound: boundary node detection algorithm for complex non-convex mobile ad hoc networks." The Journal of Supercomputing (2018): 1-20.
Design and Implementation of Lifeline Emergency Ad Hoc Network
There are real cases where mobile phones have been contributed for successful rescues in recent catastrophic disasters. Examples of such cases have been reported in history.
- http://mashable.com/2010/01/20/haiti-iphone-survivor/#mKSyzKKquiqy
- http://lubbockonline.com/filed-online/2011-10-24/5-earthquake-survivors-saved-rubble-turkey
- http://www.asiaone.com/News/Latest%2BNews/Asia/Story/A1Story20110224-265107.html
However, Public Switched Telephone Networks (PSTN), including cellular networks could be disrupted during natural disasters, such as earthquakes, hurricane, tsunami, etc.
In such situations, mobile phone users may not be able make emergency calls since cellular signal is likely to be unavailable due to the destruction of land-based network infrastructures. Although we cannot assume that all people trapped under debris will have access to their mobile phones, it is possible that some of them may still have access to their mobile phones when they are trapped under the debris or when they are waiting to be rescued.
This paper proposes a system for automatically forming ad hoc networks using mobile phones and battery-powered wireless routers for emergency situations. The system also provides functions to send emergency messages and identify the location of victims based on the network topology information.
The author’s version of a work that was accepted for publication can be downloaded from http://eric.lostcity-studio.com/wp-content/uploads/2019/08/Saving-Lives:Design-and-Implementation-of-Lifeline-Emergency-Ad-Hoc-Network.pdf.
Se-Hang Cheong, Yain-Whar Si, Leong-Hou U. “Saving Lives: Design and Implementation of Lifeline Emergency Ad Hoc Network”, International Journal of Pervasive Computing and Communications, Accepted and to appear.
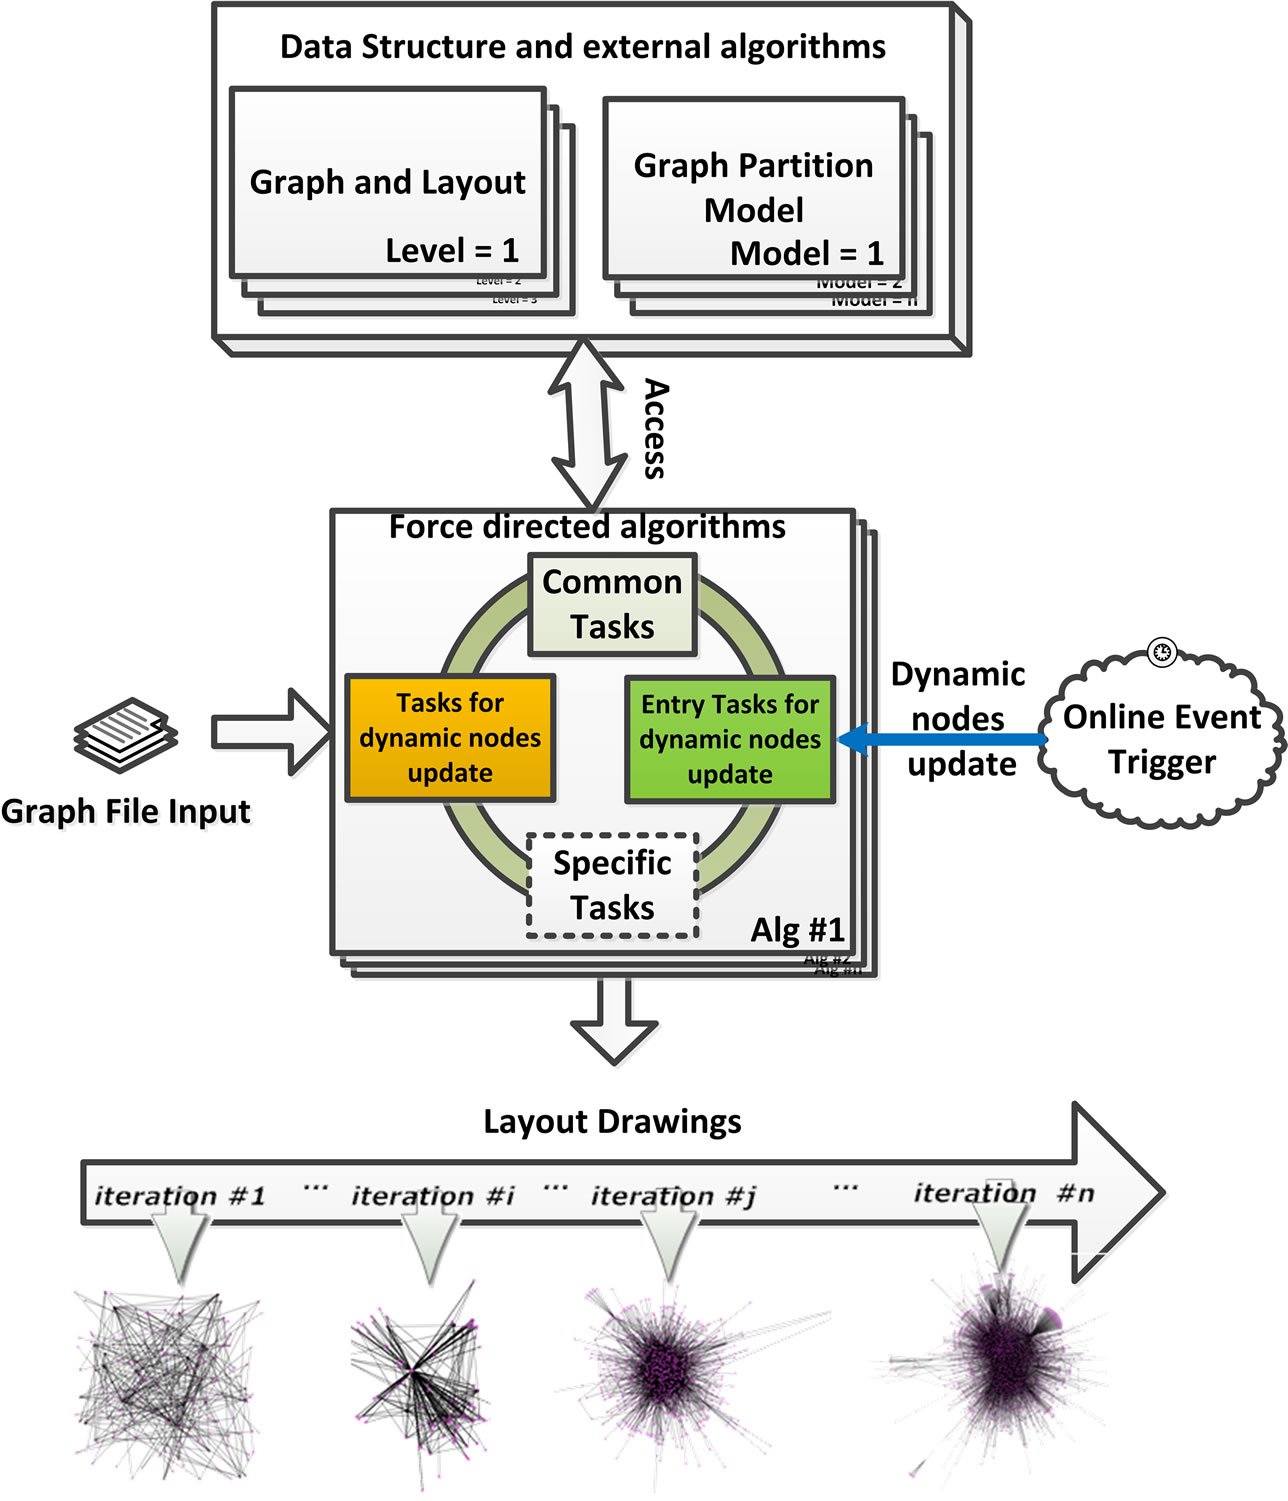
Architecture of Force-directed Algorithms
A graph layout problem, or visualization problem, refers to a set of nodes and a set of relationships (edges) built on top of this set of nodes, calculating the position of the nodes and drawing each edge as a line or curve.
One of the most important research directions in the visualization technology of graphs is the study of graph layout algorithms. The core content of the graph layout algorithm research is to study how to display the graph structure in a better way. E.g. force-directed algorithms.
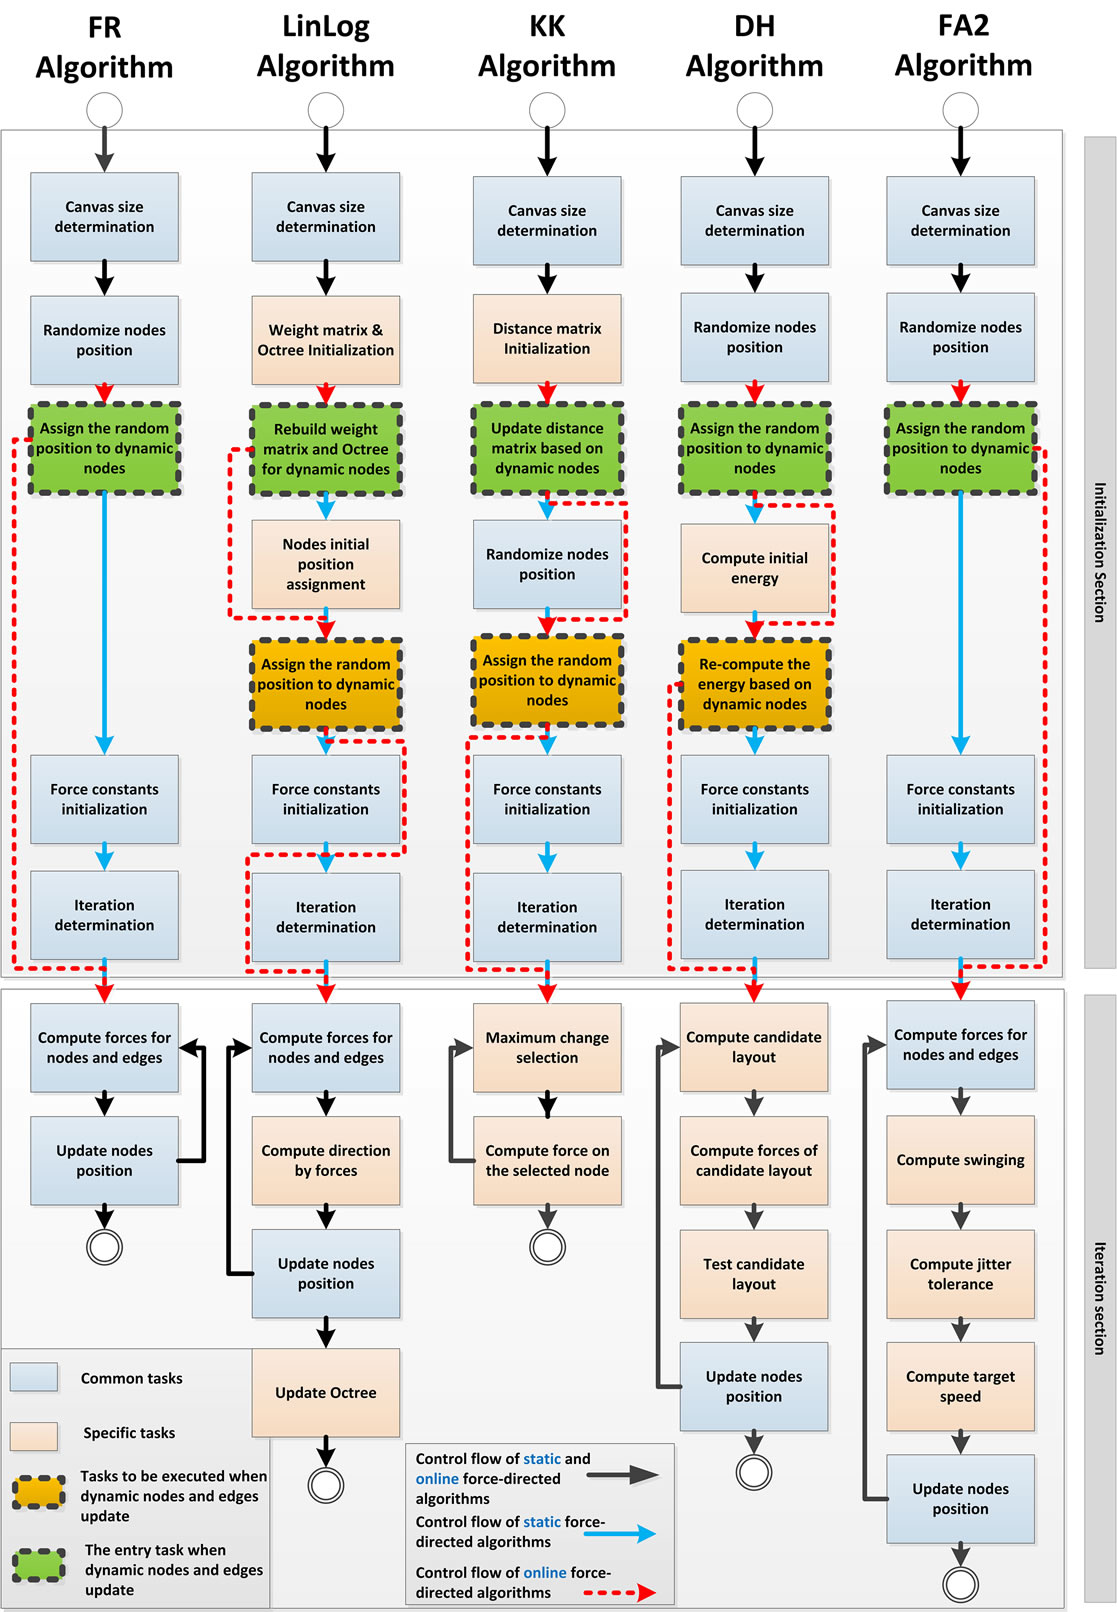
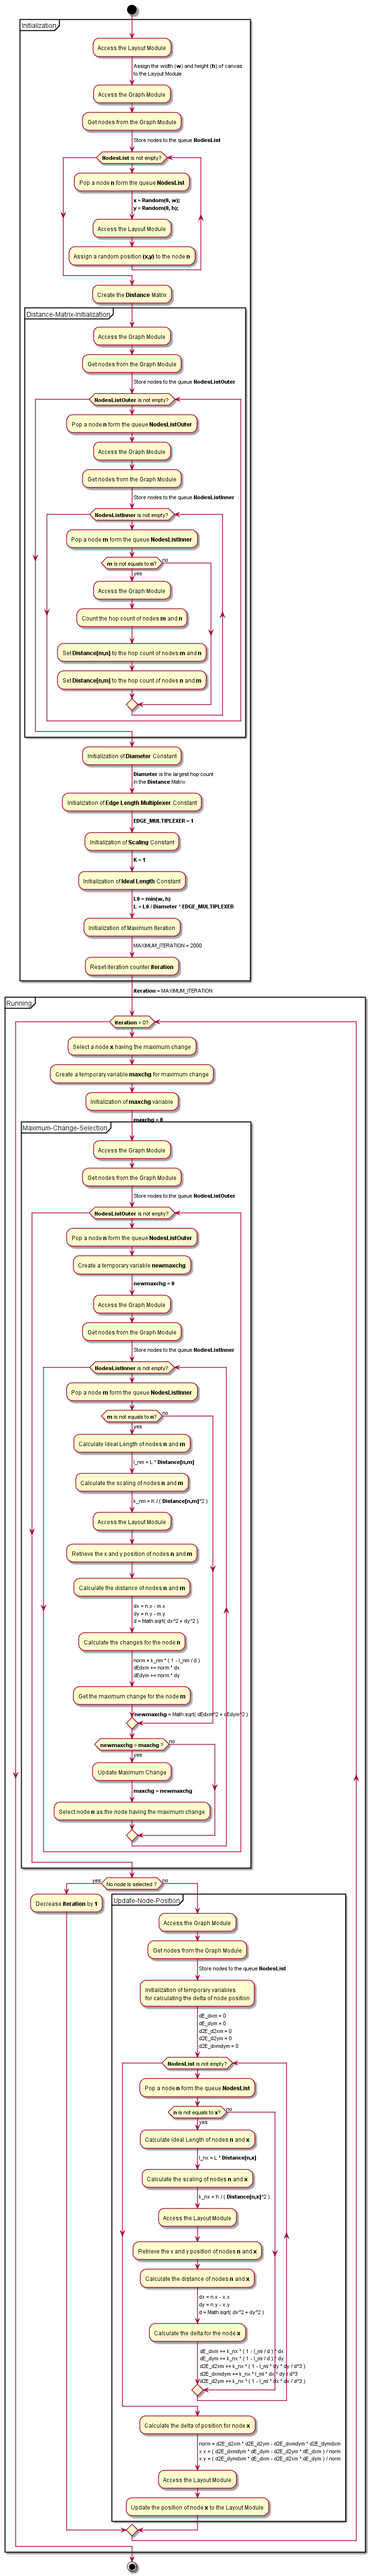
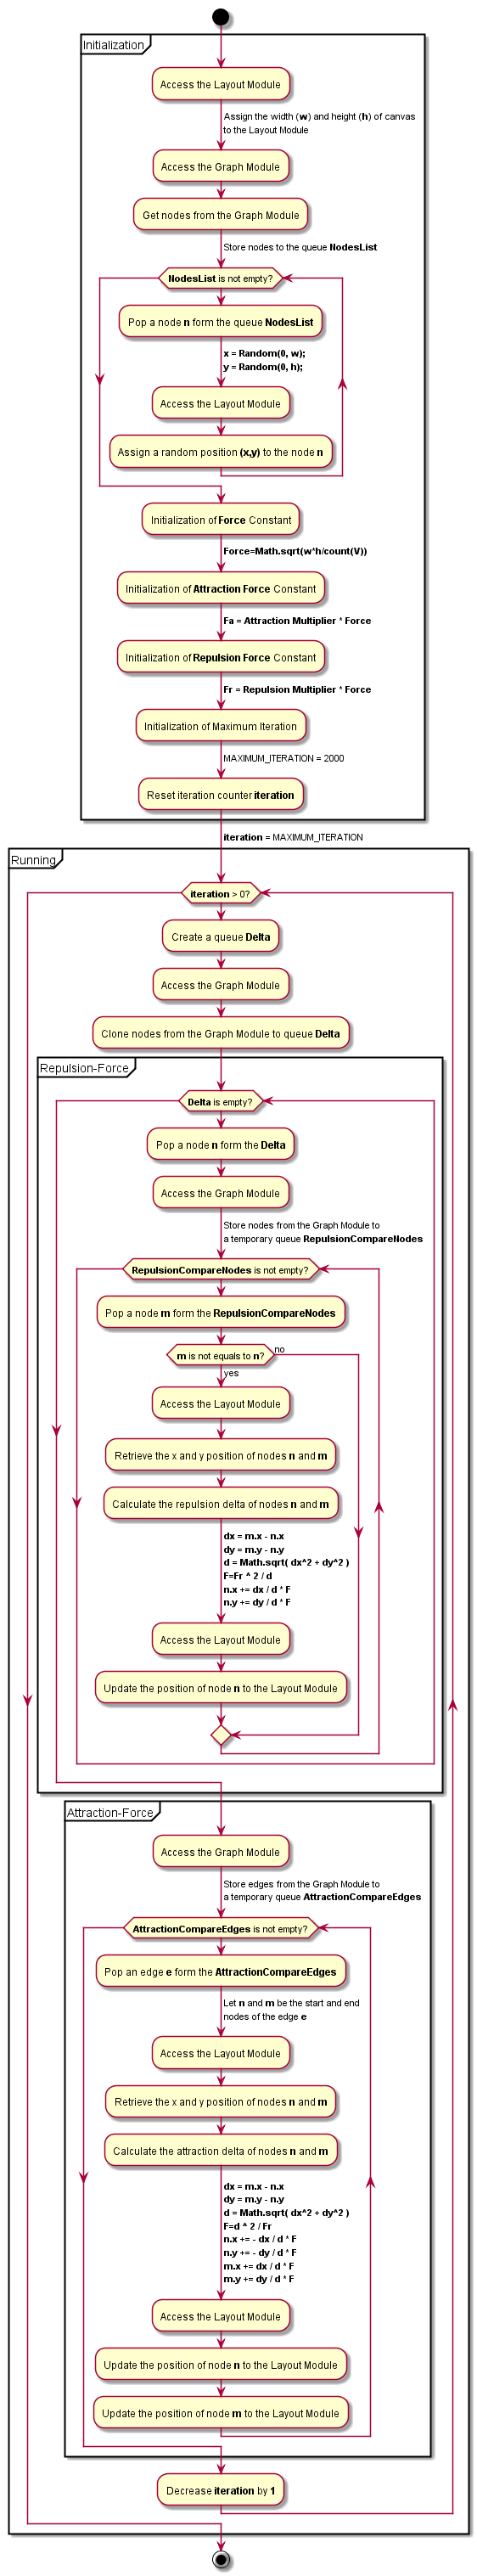
The comprehensive workflow for classical force-directed algorithms are summarized below:
- Davidson and Harel Algorithm
- LinLog Algorithm
- Kamada-Kawai Algorithm
- Fruchterman Reingold Algorithm
- ForceAtlas2 Algorithm
1. Davidson and Harel Algorithm
2. LinLog Algorithm
3. Kamada-Kawai Algorithm
4. Fruchterman Reingold Algorithm
5. ForceAtlas2 Algorithm

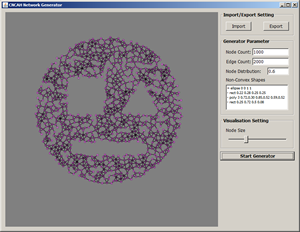
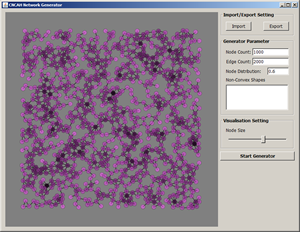
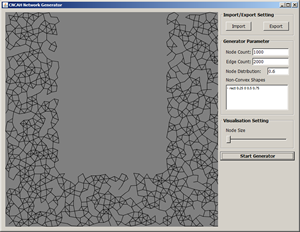
CNCAHNetGenerator – CNCAH Network Generator
CNCAHNetGenerator is written in Java 7, to enable the creation of CNCAH networks of arbitrary node and edge types.
If you use CNCAH Network Generator for your research/development, please cite the following paper: Cheong, S.-H., Si, Y.-W., 2016. Accelerating the kamada-kawai algorithm for boundary detection in a mobile ad hoc network. ACM Transactions on Sensor Networks (TOSN) 13 (1), 3. Download EndNote Format (.enw), Download BibteX Format (.bib)
License & disclaimer
Dataset of CNCAH Network
CNCAH shapes generated by the CNCAHNetGenerator. You can download the dataset from here. (more…)
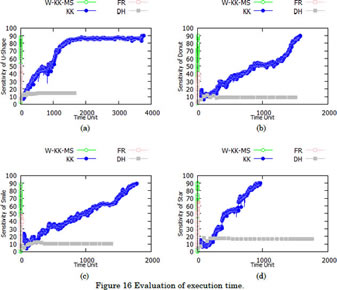
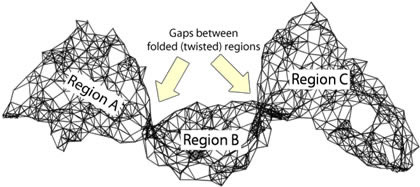
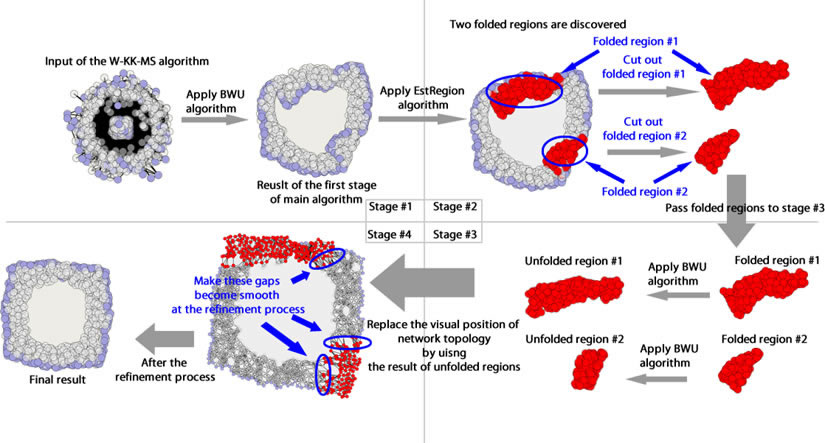
Boundary node detection and unfolding of complex non-convex ad hoc networks
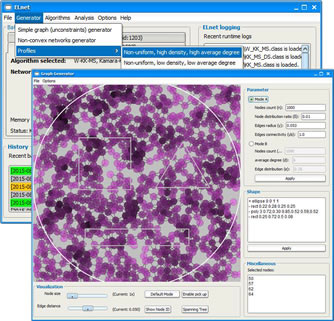
Complex non-convex ad hoc networks (CNCAH) contain intersecting polygons and edges. In many instances, the layouts of these networks are also not entirely convex in shape. In this paper, we propose a Kamada-Kawai based algorithm called W-KK-MS for boundary node detection problem, which is capable of aligning node positions while achieving high sensitivity, specificity and accuracy in producing a visual drawing from the input network topology. The algorithm put forward in this paper selects and assigns weights to top-k nodes in each iteration in order to speed up the updating process of nodes. We also propose a novel approach to detect and unfold stacked regions in CNCAH networks. Experimental results show that the proposed algorithms can achieve fast convergence on boundary node detection in CNCAH networks and are able to successfully unfold stacked regions. The design and implementation of a prototype system called ELnet for analyzing CNCAH networks is also described in this paper. The ELnet system is capable of generating synthetic networks for testing, integrating with force-directed algorithms, and visualizing and analyzing of algorithms’ outcomes.
The author’s version of a work that was accepted for publication can be downloaded from http://eric.lostcity-studio.com/wp-content/uploads/2019/08/Boundary-node-detection-and-unfolding-of-complex-non-convex-ad-hoc-networks.pdf.
Se-Hang Cheong, and Yain-Whar Si. "Boundary node detection and unfolding of complex non-convex ad hoc networks" ACM Transactions on Sensor Networks (TOSN) 14.1 (2017): 1.